materiali
sabato 8 dicembre 2012
rapporto IPCC 2007


![Le previsioni dell’IPCC (il comitato scientifico intergovernativo mondiale incaricato di stilare delle previsioni di sintesi)
IPCC 2007
1 Observed changes in climate and their effects
<
>
1.1 Observations of climate change
Since the TAR, progress in understanding how climate is changing in space and time has been gained through improvements and extensions of numerous datasets and data analyses, broader geographical coverage, better understanding of uncertainties and a wider variety of measurements. {WGI SPM
Definitions of climate change
Climate change in IPCC usage refers to a change in the state of the climate that can be identified (e.g. using statistical tests) by changes in the mean and/or the variability of its properties, and that persists for an extended period, typically decades or longer. It refers to any change in climate over time, whether due to natural variability or as a result of human activity. This usage differs from that in the United Nations Framework Convention on Climate Change (UNFCCC), where climate change refers to a change of climate that is attributed directly or indirectly to human activity that alters the composition of the global atmosphere and that is in addition to natural climate variability observed over comparable time periods.
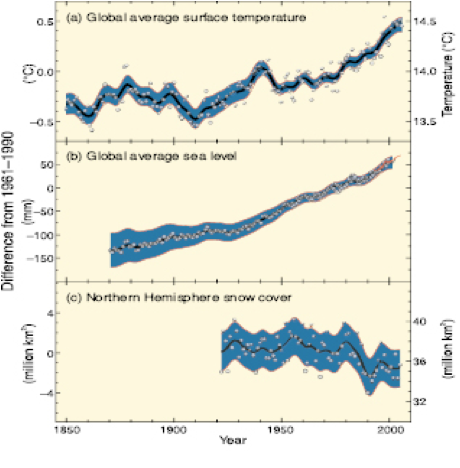
Warming of the climate system is unequivocal, as is now evident from observations of increases in global average air and ocean temperatures, widespread melting of snow and ice and rising global average sea level (Figure 1.1). {WGI 3.2, 4.8, 5.2, 5.5, SPM}
Eleven of the last twelve years (1995-2006) rank among the twelve warmest years in the instrumental record of global surface temperature (since 1850). The 100-year linear trend (1906-2005) of 0.74 [0.56 to 0.92]°C is larger than the corresponding trend of 0.6 [0.4 to 0.8]°C (1901-2000) given in the TAR (Figure 1.1). The linear warming trend over the 50 years from 1956 to 2005 (0.13 [0.10 to 0.16]°C per decade) is nearly twice that for the 100 years from 1906 to 2005. {WGI 3.2, SPM}
The temperature increase is widespread over the globe and is greater at higher northern latitudes (Figure 1.2). Average Arctic temperatures have increased at almost twice the global average rate in the past 100 years. Land regions have warmed faster than the oceans (Figures 1.2 and 2.5). Observations since 1961 show that the average temperature of the global ocean has increased to depths of at least 3000m and that the ocean has been taking up over 80% of the heat being added to the climate system. New analyses of balloon-borne and satellite measurements of lower- and mid-tropospheric temperature show warming rates similar to those observed in surface temperature. {WGI 3.2, 3.4, 5.2, SPM}
Increases in sea level are consistent with warming (Figure 1.1). Global average sea level rose at an average rate of 1.8 [1.3 to 2.3]mm per year over 1961 to 2003 and at an average rate of about 3.1 [2.4 to 3.8]mm per year from 1993 to 2003. Whether this faster rate for 1993 to 2003 reflects decadal variation or an increase in the longer-term trend is unclear. Since 1993 thermal expansion of the oceans has contributed about 57% of the sum of the estimated individual contributions to the sea level rise, with decreases in glaciers and ice caps contributing about 28% and losses from the polar ice sheets contributing the remainder. From 1993 to 2003 the sum of these climate contributions is consistent within uncertainties with the total sea level rise that is directly observed. {WGI 4.6, 4.8, 5.5, SPM, Table SPM.1}
Observed decreases in snow and ice extent are also consistent with warming (Figure 1.1). Satellite data since 1978 show that annual average Arctic sea ice extent has shrunk by 2.7 [2.1 to 3.3]% per decade, with larger decreases in summer of 7.4 [5.0 to 9.8]% per decade. Mountain glaciers and snow cover on average have declined in both hemispheres. The maximum areal extent of seasonally frozen ground has decreased by about 7% in the Northern Hemisphere since 1900, with decreases in spring of up to 15%. Temperatures at the top of the permafrost layer have generally increased since the 1980s in the Arctic by up to 3°C. {WGI 3.2, 4.5, 4.6, 4.7, 4.8, 5.5, SPM}
Changes in temperature, sea level and Northern Hemisphere snow cover

Figure 1.1. Observed changes in (a) global average surface temperature; (b) global average sea level from tide gauge (blue) and satellite (red) data; and (c) Northern Hemisphere snow cover for March-April. All differences are relative to corresponding averages for the period 1961-1990. Smoothed curves represent decadal averaged values while circles show yearly values. The shaded areas are the uncertainty intervals estimated from a comprehensive analysis of known uncertainties (a and b) and from the time series (c). {WGI FAQ 3.1 Figure 1, Figure 4.2, Figure 5.13, Figure SPM.3}
At continental, regional and ocean basin scales, numerous long-term changes in other aspects of climate have also been observed. Trends from 1900 to 2005 have been observed in precipitation amount in many large regions. Over this period, precipitation increased significantly in eastern parts of North and South America, northern Europe and northern and central Asia whereas precipitation declined in the Sahel, the Mediterranean, southern Africa and parts of southern Asia. Globally, the area affected by drought has likely[2] increased since the 1970s. {WGI 3.3, 3.9, SPM}
Some extreme weather events have changed in frequency and/or intensity over the last 50 years:
It is very likely that cold days, cold nights and frosts have become less frequent over most land areas, while hot days and hot nights have become more frequent. {WGI 3.8, SPM}
It is likely that heat waves have become more frequent over most land areas. {WGI 3.8, SPM}
It is likely that the frequency of heavy precipitation events (or proportion of total rainfall from heavy falls) has increased over most areas. {WGI 3.8, 3.9, SPM}
It is likely that the incidence of extreme high sea level[3] has increased at a broad range of sites worldwide since 1975. {WGI 5.5, SPM}
There is observational evidence of an increase in intense tropical cyclone activity in the North Atlantic since about 1970, and suggestions of increased intense tropical cyclone activity in some other regions where concerns over data quality are greater. Multi-decadal variability and the quality of the tropical cyclone records prior to routine satellite observations in about 1970 complicate the detection of long-term trends in tropical cyclone activity. {WGI 3.8, SPM}
Average Northern Hemisphere temperatures during the second half of the 20th century were very likely higher than during any other 50-year period in the last 500 years and likely the highest in at least the past 1300 years. {WGI 6.6, SPM}
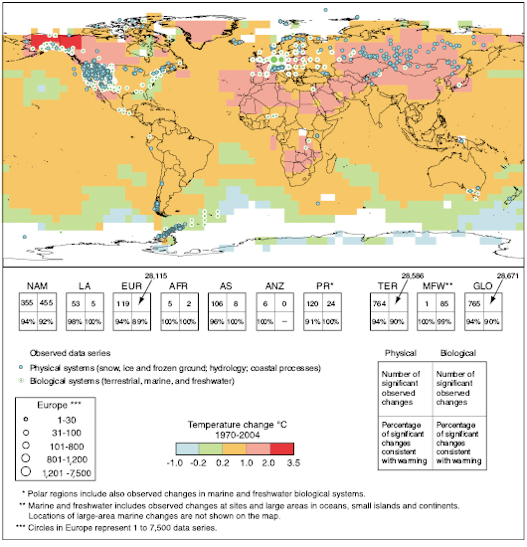
Changes in physical and biological systems and surface temperature 1970-2004

Figure 1.2. Locations of significant changes in data series of physical systems (snow, ice and frozen ground; hydrology; and coastal processes) and biological systems (terrestrial, marine, and freshwater biological systems), are shown together with surface air temperature changes over the period 1970-2004. A subset of about 29,000 data series was selected from about 80,000 data series from 577 studies. These met the following criteria: (1) ending in 1990 or later; (2) spanning a period of at least 20 years; and (3) showing a significant change in either direction, as assessed in individual studies. These data series are from about 75 studies (of which about 70 are new since the TAR) and contain about 29,000 data series, of which about 28,000 are from European studies. White areas do not contain sufficient observational climate data to estimate a temperature trend. The 2 x 2 boxes show the total number of data series with significant changes (top row) and the percentage of those consistent with warming (bottom row) for (i) continental regions: North America (NAM), Latin America (LA), Europe (EUR), Africa (AFR), Asia (AS), Australia and New Zealand (ANZ), and Polar Regions (PR) and (ii) global-scale: Terrestrial (TER), Marine and Freshwater (MFW), and Global (GLO). The numbers of studies from the seven regional boxes (NAM, …, PR) do not add up to the global (GLO) totals because numbers from regions except Polar do not include the numbers related to Marine and Freshwater (MFW) systems. Locations of large-area marine changes are not shown on the map. {WGII Figure SPM.1, Figure 1.8, Figure 1.9; WGI Figure 3.9b}
^ Likelihood and confidence statements in italics represent calibrated expressions of uncertainty and confidence. See Box ‘Treatment of uncertainty’ in the Introduction for an explanation of these terms.
^ Excluding tsunamis, which are not due to climate change. Extreme high sea level depends on average sea level and on regional weather systems. It is defined here as the highest 1% of hourly values of observed sea level at a station for a given reference period.
AR4 Reports | Table of Contents | Top of page | Previous Page | Next page

2.3 Climate sensitivity and feedbacks
<
>
The equilibrium climate sensitivity is a measure of the climate system response to sustained radiative forcing. It is defined as the equilibrium global average surface warming following a doubling of CO2 concentration. Progress since the TAR enables an assessment that climate sensitivity is likely to be in the range of 2 to 4.5°C with a best estimate of about 3°C, and is very unlikely to be less than 1.5°C. Values substantially higher than 4.5°C cannot be excluded, but agreement of models with observations is not as good for those values. {WGI 8.6, 9.6, Box 10.2, SPM}
Feedbacks can amplify or dampen the response to a given forcing. Direct emission of water vapour (a greenhouse gas) by human activities makes a negligible contribution to radiative forcing. However, as global average temperature increases, tropospheric water vapour concentrations increase and this represents a key positive feedback but not a forcing of climate change. Water vapour changes represent the largest feedback affecting equilibrium climate sensitivity and are now better understood than in the TAR. Cloud feedbacks remain the largest source of uncertainty. Spatial patterns of climate response are largely controlled by climate processes and feedbacks. For example, sea-ice albedo feedbacks tend to enhance the high latitude response. {WGI 2.8, 8.6, 9.2, TS.2.1.3, TS.2.5, SPM}
Warming reduces terrestrial and ocean uptake of atmospheric CO2, increasing the fraction of anthropogenic emissions remaining in the atmosphere. This positive carbon cycle feedback leads to larger atmospheric CO2 increases and greater climate change for a given emissions scenario, but the strength of this feedback effect varies markedly among models. {WGI 7.3, TS.5.4, SPM; WGII 4.4}
Continued GHG emissions at or above current rates would cause further warming and induce many changes in the global climate system during the 21st century that would very likely be larger than those observed during the 20th century. {WGI 10.3}
Advances in climate change modelling now enable best estimates and likely assessed uncertainty ranges to be given for projected warming for different emissions scenarios. Table 3.1 shows best estimates and likely ranges for global average surface air warming for the six SRES marker emissions scenarios (including climate-carbon cycle feedbacks). {WGI 10.5}
Table 3.1. Projected global average surface warming and sea level rise at the end of the 21st century. {WGI 10.5, 10.6, Table 10.7, Table SPM.3}Sea level rise (m at 2090-2099 relatLikely rModel-based range excluding future rapid dynamical changes in ice flow
Constant year 2000 concentrations
0.6
0.3 – 0.9
Not available
B1 scenario
1.8
1.1 – 2.9
0.18 – 0.38
A1T scenario
2.4
1.4 – 3.8
0.20 – 0.45
B2 scenario
2.4
1.4 – 3.8
0.20 – 0.43
A1B scenario
2.8
1.7 – 4.4
0.21 – 0.48
A2 scenario
3.4
2.0 – 5.4
0.23 – 0.51
A1FI scenario
4.0
2.4 – 6.4
0.26 – 0.59
Notes:
a) These estimates are assessed from a hierarchy of models that encompass a simple climate model, several Earth Models of Intermediate Complexity, and a large number of Atmosphere-Ocean General Circulation Models (AOGCMs) as well as observational constraints.
b) Year 2000 constant composition is derived from AOGCMs only.
c) All scenarios above are six SRES marker scenarios. Approximate CO2-eq concentrations corresponding to the computed radiative forcing due to anthropogenic GHGs and aerosols in 2100 (see p. 823 of the WGI TAR) for the SRES B1, AIT, B2, A1B, A2 and A1FI illustrative marker scenarios are about 600, 700, 800, 850, 1250 and 1550ppm, respectively.
d) Temperature changes are expressed as the difference from the period 1980-1999. To express the change relative to the period 1850-1899 add 0.5°C.
Although these projections are broadly consistent with the span quoted in the TAR (1.4 to 5.8°C), they are not directly comparable. Assessed upper ranges for temperature projections are larger than in the TAR mainly because the broader range of models now available suggests stronger climate-carbon cycle feedbacks. For the A2 scenario, for example, the climate-carbon cycle feedback increases the corresponding global average warming at 2100 by more than 1°C. Carbon feedbacks are discussed in Topic 2.3. {WGI 7.3, 10.5, SPM}
Because understanding of some important effects driving sea level rise is too limited, this report does not assess the likelihood, nor provide a best estimate or an upper bound for sea level rise. Model-based projections of global average sea level rise at the end of the 21st century (2090-2099) are shown in Table 3.1. For each scenario, the mid-point of the range in Table 3.1 is within 10% of the TAR model average for 2090-2099. The ranges are narrower than in the TAR mainly because of improved information about some uncertainties in the projected contributions.[12] The sea level projections do not include uncertainties in climate-carbon cycle feedbacks nor do they include the full effects of changes in ice sheet flow, because a basis in published literature is lacking. Therefore the upper values of the ranges given are not to be considered upper bounds for sea level rise. The projections include a contribution due to increased ice flow from Greenland and Antarctica at the rates observed for 1993-2003, but these flow rates could increase or decrease in the future. If this contribution were to grow linearly with global average temperature change, the upper ranges of sea level rise for SRES scenarios shown in Table 3.1 would increase by 0.1 to 0.2m.[13] {WGI 10.6, SPM}
3.2.2 21st century regional changes
<
>
There is now higher confidence than in the TAR in projected patterns of warming and other regional-scale features, including changes in wind patterns, precipitation and some aspects of extremes and sea ice. {WGI 8.2, 8.3, 8.4, 8.5, 9.4, 9.5, 10.3, 11.1}
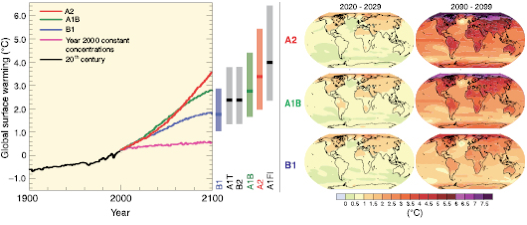
Projected warming in the 21st century shows scenario-independent geographical patterns similar to those observed over the past several decades. Warming is expected to be greatest over land and at most high northern latitudes, and least over the Southern Ocean (near Antarctica) and northern North Atlantic, continuing recent observed trends (Figure 3.2 right panels). {WGI 10.3, SPM
Atmosphere-Ocean General Circulation Model projections of surface warming

Figure 3.2. Left panel: Solid lines are multi-model global averages of surface warming (relative to 1980-1999) for the SRES scenarios A2, A1B and B1, shown as continuations of the 20th century simulations. The orange line is for the experiment where concentrations were held constant at year 2000 values. The bars in the middle of the figure indicate the best estimate (solid line within each bar) and the likely range assessed for the six SRES marker scenarios at 2090-2099 relative to 1980-1999. The assessment of the best estimate and likely ranges in the bars includes the Atmosphere-Ocean General Circulation Models (AOGCMs) in the left part of the figure, as well as results from a hierarchy of independent models and observational constraints. Right panels: Projected surface temperature changes for the early and late 21st century relative to the period 1980-1999. The panels show the multi-AOGCM average projections for the A2 (top), A1B (middle) and B1 (bottom) SRES scenarios averaged over decades 2020-2029 (left) and 2090-2099 (right). {WGI 10.4, 10.8, Figures 10.28, 10.29, SPM}
Snow cover area is projected to contract. Widespread increases in thaw depth are projected over most permafrost regions. Sea ice is projected to shrink in both the Arctic and Antarctic under all SRES scenarios. In some projections, Arctic late-summer sea ice disappears almost entirely by the latter part of the 21st century. {WGI 10.3, 10.6, SPM; WGII 15.3.4}
It is very likely that hot extremes, heat waves and heavy precipitation events will become more frequent. {SYR Table 3.2; WGI 10.3, SPM}
Based on a range of models, it is likely that future tropical cyclones (typhoons and hurricanes) will become more intense, with larger peak wind speeds and more heavy precipitation associated with ongoing increases of tropical sea-surface temperatures. There is less confidence in projections of a global decrease in numbers of tropical cyclones. The apparent increase in the proportion of very intense storms since 1970 in some regions is much larger than simulated by current models for that period. {WGI 3.8, 9.5, 10.3, SPM}
Extra-tropical storm tracks are projected to move poleward, with consequent changes in wind, precipitation and temperature patterns, continuing the broad pattern of observed trends over the last half-century. {WGI 3.6, 10.3, SPM}
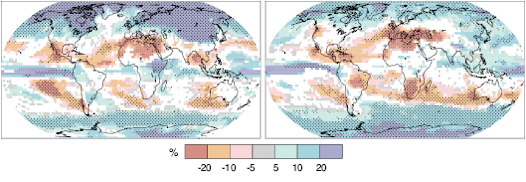
Since the TAR there is an improving understanding of projected patterns of precipitation. Increases in the amount of precipitation are very likely in high-latitudes, while decreases are likely in most subtropical land regions (by as much as about 20% in the A1B scenario in 2100, Figure 3.3), continuing observed patterns in recent trends. {WGI 3.3, 8.3, 9.5, 10.3, 11.2-11.9, SPM}
Multi-model projected patterns of precipitation changes

Figure 3.3. Relative changes in precipitation (in percent) for the period 2090-2099, relative to 1980-1999. Values are multi-model averages based on the SRES A1B scenario for December to February (left) and June to August (right). White areas are where less than 66% of the models agree in the sign of the change and stippled areas are where more than 90% of the models agree in the sign of the change. {WGI Figure 10.9, SPM}
AR4 Reports | Table of Contents | Top of page | Previous Page | Next page

3.2.3 Changes beyond the 21st century
<
>
Anthropogenic warming and sea level rise would continue for centuries due to the time scales associated with climate processes and feedbacks, even if GHG concentrations were to be stabilised. {WGI 10.4, 10.5, 10.7, SPM}
If radiative forcing were to be stabilised, keeping all the radiative forcing agents constant at B1 or A1B levels in 2100, model experiments show that a further increase in global average temperature of about 0.5°C would still be expected by 2200. In addition, thermal expansion alone would lead to 0.3 to 0.8m of sea level rise by 2300 (relative to 1980-1999). Thermal expansion would continue for many centuries, due to the time required to transport heat into the deep ocean. {WGI 10.7, SPM}
Contraction of the Greenland ice sheet is projected to continue to contribute to sea level rise after 2100. Current models suggest ice mass losses increase with temperature more rapidly than gains due to increased precipitation and that the surface mass balance becomes negative (net ice loss) at a global average warming (relative to pre-industrial values) in excess of 1.9 to 4.6°C. If such a negative surface mass balance were sustained for millennia, that would lead to virtually complete elimination of the Greenland ice sheet and a resulting contribution to sea level rise of about 7m. The corresponding future temperatures in Greenland (1.9 to 4.6°C global) are comparable to those inferred for the last interglacial period 125,000 years ago, when palaeoclimatic information suggests reductions of polar land ice extent and 4 to 6m of sea level rise. {WGI 6.4, 10.7, SPM}
Dynamical processes related to ice flow – which are not included in current models but suggested by recent observations – could increase the vulnerability of the ice sheets to warming, increasing future sea level rise. Understanding of these processes is limited and there is no consensus on their magnitude. {WGI 4.6, 10.7, SPM}
Current global model studies project that the Antarctic ice sheet will remain too cold for widespread surface melting and gain mass due to increased snowfall. However, net loss of ice mass could occur if dynamical ice discharge dominates the ice sheet mass balance. {WGI 10.7, SPM}
Both past and future anthropogenic CO2 emissions will continue to contribute to warming and sea level rise for more than a millennium, due to the time scales required for the removal of this gas from the atmosphere. {WGI 7.3, 10.3, Figure 7.12, Figure 10.35, SPM}
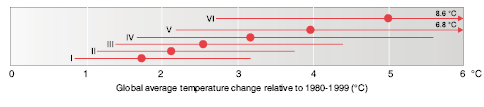
Estimated long-term (multi-century) warming corresponding to the six AR4 WG III stabilisation categories is shown in Figure 3.4.
Estimated multi-century warming relative to 1980-1999 for AR4 stabilisation categories

Figure 3.4. Estimated long-term (multi-century) warming corresponding to the six AR4 WG III stabilisation categories (Table 5.1). The temperature scale has been shifted by -0.5°C compared to Table 5.1 to account approximately for the warming between pre-industrial and 1980-1999. For most stabilisation levels global average temperature is approaching the equilibrium level over a few centuries. For GHG emissions scenarios that lead to stabilisation at levels comparable to SRES B1 and A1B by 2100 (600 and 850 ppm CO2-eq; category IV and V), assessed models project that about 65 to 70% of the estimated global equilibrium temperature increase, assuming a climate sensitivity of 3°C, would be realised at the time of stabilisation. For the much lower stabilisation scenarios (category I and II, Figure 5.1), the equilibrium temperature may be reached earlier. {WGI 10.7.2}
AR4 Reports | Table of Contents | Top of page | Previous Page | Next page
3.3.1 Impacts on systems and sectors
<
>
Ecosystems
The resilience of many ecosystems is likely to be exceeded this century by an unprecedented combination of climate change, associated disturbances (e.g. flooding, drought, wildfire, insects, ocean acidification) and other global change drivers (e.g. land-use change, pollution, fragmentation of natural systems, over-exploitation of resources). {WGII 4.1-4.6, SPM}
Over the course of this century, net carbon uptake by terrestrial ecosystems is likely to peak before mid-century and then weaken or even reverse[16], thus amplifying climate change. {WGII 4.ES, Figure 4.2, SPM}
Approximately 20 to 30% of plant and animal species assessed so far are likely to be at increased risk of extinction if increases in global average temperature exceed 1.5 to 2.5°C (medium confidence). {WGII 4.ES, Figure 4.2, SPM}
For increases in global average temperature exceeding 1.5 to 2.5°C and in concomitant atmospheric CO2 concentrations, there are projected to be major changes in ecosystem structure and function, species’ ecological interactions and shifts in species’ geographical ranges, with predominantly negative consequences for biodiversity and ecosystem goods and services, e.g. water and food supply. {WGII 4.4, Box TS.6, SPM}
Food
Crop productivity is projected to increase slightly at mid- to high latitudes for local mean temperature increases of up to 1 to 3°C depending on the crop, and then decrease beyond that in some regions (medium confidence). {WGII 5.4, SPM}
At lower latitudes, especially in seasonally dry and tropical regions, crop productivity is projected to decrease for even small local temperature increases (1 to 2°C), which would increase the risk of hunger (medium confidence). {WGII 5.4, SPM}
Globally, the potential for food production is projected to increase with increases in local average temperature over a range of 1 to 3°C, but above this it is projected to decrease (medium confidence). {WGII 5.4, 5.5, SPM}
Coasts
Coasts are projected to be exposed to increasing risks, including coastal erosion, due to climate change and sea level rise. The effect will be exacerbated by increasing human-induced pressures on coastal areas (very high confidence). {WGII 6.3, 6.4, SPM}
By the 2080s, many millions more people than today are projected to experience floods every year due to sea level rise. The numbers affected will be largest in the densely populated and low-lying megadeltas of Asia and Africa while small islands are especially vulnerable (very high confidence). {WGII 6.4, 6.5, Table 6.11, SPM}
Industry, settlements and society
The most vulnerable industries, settlements and societies are generally those in coastal and river flood plains, those whose economies are closely linked with climate-sensitive resources and those in areas prone to extreme weather events, especially where rapid urbanisation is occurring. {WGII 7.1, 7.3, 7.4, 7.5, SPM}
Poor communities can be especially vulnerable, in particular those concentrated in high-risk areas. {WGII 7.2, 7.4, 5.4, SPM}
Health
The health status of millions of people is projected to be affected through, for example, increases in malnutrition; increased deaths, diseases and injury due to extreme weather events; increased burden of diarrhoeal diseases; increased frequency of cardio-respiratory diseases due to higher concentrations of ground-level ozone in urban areas related to climate change; and the altered spatial distribution of some infectious diseases. {WGI 7.4, Box 7.4; WGII 8.ES, 8.2, 8.4, SPM}
Climate change is projected to bring some benefits in temperate areas, such as fewer deaths from cold exposure, and some mixed effects such as changes in range and transmission potential of malaria in Africa. Overall it is expected that benefits will be outweighed by the negative health effects of rising temperatures, especially in developing countries. {WGII 8.4, 8.7, 8.ES, SPM}
Critically important will be factors that directly shape the health of populations such as education, health care, public health initiatives, and infrastructure and economic development. {WGII 8.3, SPM}
Water
Water impacts are key for all sectors and regions. These are discussed below in the Box ‘Climate change and water’.
Climate change and water
Climate change is expected to exacerbate current stresses on water resources from population growth and economic and land-use change, including urbanisation. On a regional scale, mountain snow pack, glaciers and small ice caps play a crucial role in freshwater availability. Widespread mass losses from glaciers and reductions in snow cover over recent decades are projected to accelerate throughout the 21st century, reducing water availability, hydropower potential, and changing seasonality of flows in regions supplied by meltwater from major mountain ranges (e.g. Hindu-Kush, Himalaya, Andes), where more than one-sixth of the world population currently lives. {WGI 4.1, 4.5; WGII 3.3, 3.4, 3.5}
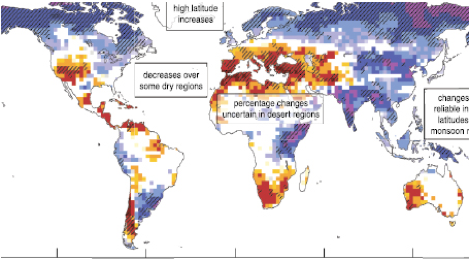
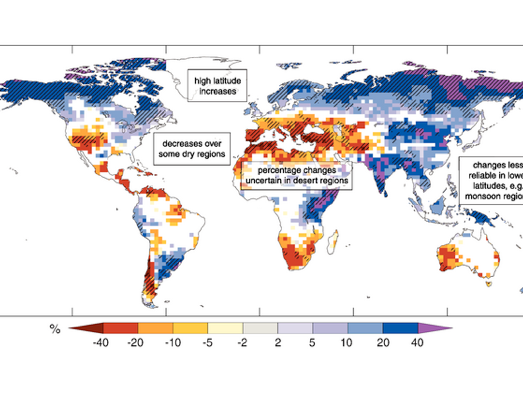
Changes in precipitation (Figure 3.3) and temperature (Figure 3.2) lead to changes in runoff (Figure 3.5) and water availability. Runoff is projected with high confidence to increase by 10 to 40% by mid-century at higher latitudes and in some wet tropical areas, including populous areas in East and South-East Asia, and decrease by 10 to 30% over some dry regions at mid-latitudes and dry tropics, due to decreases in rainfall and higher rates of evapotranspiration. There is also high confidence that many semi-arid areas (e.g. the Mediterranean Basin, western United States, southern Africa and north-eastern Brazil) will suffer a decrease in water resources due to climate change. Drought-affected areas are projected to increase in extent, with the potential for adverse impacts on multiple sectors, e.g. agriculture, water supply, energy production and health. Regionally, large increases in irrigation water demand as a result of climate changes are projected. {WGI 10.3, 11.2-11.9; WGII 3.4, 3.5, Figure 3.5, TS.4.1, Box TS.5, SPM}
The negative impacts of climate change on freshwater systems outweigh its benefits (high confidence). Areas in which runoff is projected to decline face a reduction in the value of the services provided by water resources (very high confidence). The beneficial impacts of increased annual runoff in some areas are likely to be tempered by negative effects of increased precipitation variability and seasonal runoff shifts on water supply, water quality and flood risk. {WGII 3.4, 3.5, TS.4.1}
Available research suggests a significant future increase in heavy rainfall events in many regions, including some in which the mean rainfall is projected to decrease. The resulting increased flood risk poses challenges to society, physical infrastructure and water quality. It is likely that up to 20% of the world population will live in areas where river flood potential could increase by the 2080s. Increases in the frequency and severity of floods and droughts are projected to adversely affect sustainable development. Increased temperatures will further affect the physical, chemical and biological properties of freshwater lakes and rivers, with predominantly adverse impacts on many individual freshwater species, community composition and water quality. In coastal areas, sea level rise will exacerbate water resource constraints due to increased salinisation of groundwater supplies. {WGI 11.2-11.9; WGII 3.2, 3.3, 3.4, 4.4}
Projections and model consistency of relative changes in runoff by the end of the 21st century

Figure 3.5. Large-scale relative changes in annual runoff (water availability, in percent) for the period 2090-2099, relative to 1980-1999. Values represent the median of 12 climate models using the SRES A1B scenario. White areas are where less than 66% of the 12 models agree on the sign of change and hatched areas are where more than 90% of models agree on the sign of change. The quality of the simulation of the observed large-scale 20th century runoff is used as a basis for selecting the 12 models from the multi-model ensemble. The global map of annual runoff illustrates a large scale and is not intended to refer to smaller temporal and spatial scales. In areas where rainfall and runoff is very low (e.g. desert areas), small changes in runoff can lead to large percentage changes. In some regions, the sign of projected changes in runoff differs from recently observed trends. In some areas with projected increases in runoff, different seasonal effects are expected, such as increased wet season runoff and decreased dry season runoff. Studies using results from few climate models can be considerably different from the results presented here. {WGII Figure 3.4, adjusted to match the assumptions of SYR Figure SYR 3.3; WGII 3.3.1, 3.4.1, 3.5.1}
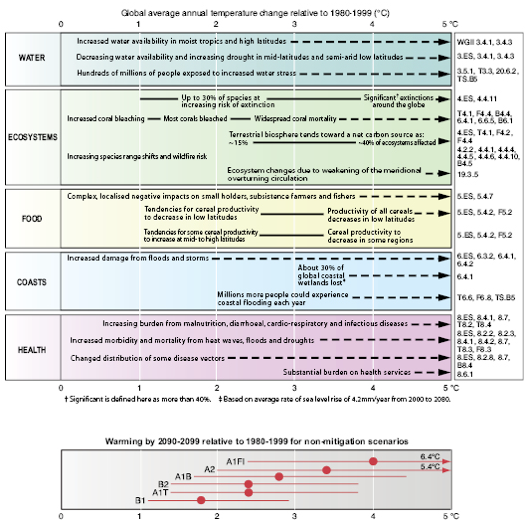
Studies since the TAR have enabled more systematic understanding of the timing and magnitude of impacts related to differing amounts and rates of climate change. {WGII SPM}
Examples of this new information for systems and sectors are presented in Figure 3.6. The upper panel shows impacts increasing with increasing temperature change. Their estimated magnitude and timing is also affected by development pathways (lower panel). {WGII SPM}
Depending on circumstances, some of the impacts shown in Figure 3.6 could be associated with ‘key vulnerabilities’, based on a number of criteria in the literature (magnitude, timing, persistence/reversibility, the potential for adaptation, distributional aspects, likelihood and ‘importance’ of the impacts) (see Topic 5.2). {WGII SPM}
Examples of impacts associated with global average temperature change (Impacts will vary by extent of adaptation, rate of temperature change and socio-economic pathway)

Figure 3.6. Examples of impacts associated with global average temperature change. Upper panel: Illustrative examples of global impacts projected for climate changes (and sea level and atmospheric CO2 where relevant) associated with different amounts of increase in global average surface temperature in the 21st century. The black lines link impacts; broken-line arrows indicate impacts continuing with increasing temperature. Entries are placed so that the left-hand side of text indicates the approximate level of warming that is associated with the onset of a given impact. Quantitative entries for water scarcity and flooding represent the additional impacts of climate change relative to the conditions projected across the range of SRES scenarios A1FI, A2, B1 and B2. Adaptation to climate change is not included in these estimations. Confidence levels for all statements are high. The upper right panel gives the WG II references for the statements made in the upper left panel.* Lower panel: Dots and bars indicate the best estimate and likely ranges of warming assessed for the six SRES marker scenarios for 2090-2099 relative to 1980-1999. {WGI Figure SPM.5, 10.7; WGII Figure SPM.2; WGIII Table TS.2, Table 3.10}
*Where ES = Executive Summary, T = Table, B = Box and F = Figure. Thus B4.5 indicates Box 4.5 in Chapter 4 and 3.5.1 indicates Section 3.5.1 in Chapter 3.
^ Assuming continued GHG emissions at or above current rates and other global changes including land-use changes.
3.3.2 Impacts on regions[17]
<
>
Africa
By 2020, between 75 and 250 million of people are projected to be exposed to increased water stress due to climate change. {WGII 9.4, SPM}
By 2020, in some countries, yields from rain-fed agriculture could be reduced by up to 50%. Errata Agricultural production, including access to food, in many African countries is projected to be severely compromised. This would further adversely affect food security and exacerbate malnutrition. {WGII 9.4, SPM}
Towards the end of the 21st century, projected sea level rise will affect low-lying coastal areas with large populations. The cost of adaptation could amount to at least 5 to 10% of GDP. {WGII 9.4, SPM}
By 2080, an increase of 5 to 8% of arid and semi-arid land in Africa is projected under a range of climate scenarios (high confidence). {WGII Box TS.6, 9.4.4}
Asia
By the 2050s, freshwater availability in Central, South, East and South-East Asia, particularly in large river basins, is projected to decrease. {WGII 10.4, SPM}
Coastal areas, especially heavily populated megadelta regions in South, East and South-East Asia, will be at greatest risk due to increased flooding from the sea and, in some megadeltas, flooding from the rivers. {WGII 10.4, SPM}
Climate change is projected to compound the pressures on natural resources and the environment associated with rapid urbanisation, industrialisation and economic development. {WGII 10.4, SPM}
Endemic morbidity and mortality due to diarrhoeal disease primarily associated with floods and droughts are expected to rise in East, South and South-East Asia due to projected changes in the hydrological cycle. {WGII 10.4, SPM}
Australia and New Zealand
By 2020, significant loss of biodiversity is projected to occur in some ecologically rich sites, including the Great Barrier Reef and Queensland Wet Tropics. {WGII 11.4, SPM}
By 2030, water security problems are projected to intensify in southern and eastern Australia and, in New Zealand, in Northland and some eastern regions. {WGII 11.4, SPM}
By 2030, production from agriculture and forestry is projected to decline over much of southern and eastern Australia, and over parts of eastern New Zealand, due to increased drought and fire. However, in New Zealand, initial benefits are projected in some other regions. {WGII 11.4, SPM}
By 2050, ongoing coastal development and population growth in some areas of Australia and New Zealand are projected to exacerbate risks from sea level rise and increases in the severity and frequency of storms and coastal flooding. {WGII 11.4, SPM}
Europe
Climate change is expected to magnify regional differences in Europe’s natural resources and assets. Negative impacts will include increased risk of inland flash floods and more frequent coastal flooding and increased erosion (due to storminess and sea level rise). {WGII 12.4, SPM}
Mountainous areas will face glacier retreat, reduced snow cover and winter tourism, and extensive species losses (in some areas up to 60% under high emissions scenarios by 2080). {WGII 12.4, SPM}
In southern Europe, climate change is projected to worsen conditions (high temperatures and drought) in a region already vulnerable to climate variability, and to reduce water availability, hydropower potential, summer tourism and, in general, crop productivity. {WGII 12.4, SPM}
Climate change is also projected to increase the health risks due to heat waves and the frequency of wildfires. {WGII 12.4, SPM}
Latin America
By mid-century, increases in temperature and associated decreases in soil water are projected to lead to gradual replacement of tropical forest by savanna in eastern Amazonia. Semi-arid vegetation will tend to be replaced by arid-land vegetation. {WGII 13.4, SPM}
There is a risk of significant biodiversity loss through species extinction in many areas of tropical Latin America. {WGII 13.4, SPM}
Productivity of some important crops is projected to decrease and livestock productivity to decline, with adverse consequences for food security. In temperate zones, soybean yields are projected to increase. Overall, the number of people at risk of hunger is projected to increase (medium confidence). {WGII 13.4, Box TS.6}
Changes in precipitation patterns and the disappearance of glaciers are projected to significantly affect water availability for human consumption, agriculture and energy generation. {WGII 13.4, SPM}
North America
Warming in western mountains is projected to cause decreased snowpack, more winter flooding and reduced summer flows, exacerbating competition for over-allocated water resources. {WGII 14.4, SPM}
In the early decades of the century, moderate climate change is projected to increase aggregate yields of rain-fed agriculture by 5 to 20%, but with important variability among regions. Major challenges are projected for crops that are near the warm end of their suitable range or which depend on highly utilised water resources. {WGII 14.4, SPM}
Cities that currently experience heat waves are expected to be further challenged by an increased number, intensity and duration of heat waves during the course of the century, with potential for adverse health impacts. {WGII 14.4, SPM}
Coastal communities and habitats will be increasingly stressed by climate change impacts interacting with development and pollution. {WGII 14.4, SPM}
Polar Regions
The main projected biophysical effects are reductions in thickness and extent of glaciers, ice sheets and sea ice, and changes in natural ecosystems with detrimental effects on many organisms including migratory birds, mammals and higher predators. {WGII 15.4, SPM}
For human communities in the Arctic, impacts, particularly those resulting from changing snow and ice conditions, are projected to be mixed. {WGII 15.4, SPM}
Detrimental impacts would include those on infrastructure and traditional indigenous ways of life. {WGII 15.4, SPM}
In both polar regions, specific ecosystems and habitats are projected to be vulnerable, as climatic barriers to species invasions are lowered. {WGII 15.4, SPM}
Small Islands
Sea level rise is expected to exacerbate inundation, storm surge, erosion and other coastal hazards, thus threatening vital infrastructure, settlements and facilities that support the livelihood of island communities. {WGII 16.4, SPM}
Deterioration in coastal conditions, for example through erosion of beaches and coral bleaching, is expected to affect local resources. {WGII 16.4, SPM}
By mid-century, climate change is expected to reduce water resources in many small islands, e.g. in the Caribbean and Pacific, to the point where they become insufficient to meet demand during low-rainfall periods. {WGII 16.4, SPM}
With higher temperatures, increased invasion by non-native species is expected to occur, particularly on mid- and high-latitude islands. {WGII 16.4, SPM}
^ Unless stated explicitly, all entries are from WG II SPM text, and are either very high confidence or high confidence statements, reflecting different sectors (agriculture, ecosystems, water, coasts, health, industry and settlements). The WG II SPM refers to the source of the statements, timelines and temperatures. The magnitude and timing of impacts that will ultimately be realised will vary with the amount and rate of climate change, emissions scenarios, development pathways and adaptation.
3.3.3 Especially affected systems, sectors and regions
<
>
Some systems, sectors and regions are likely to be especially affected by climate change.[18] {WGII TS.4.5}
Systems and sectors: {WGII TS.4.5}
particular ecosystems:
terrestrial: tundra, boreal forest and mountain regions because of sensitivity to warming; mediterranean-type ecosystems because of reduction in rainfall; and tropical rainforests where precipitation declines
coastal: mangroves and salt marshes, due to multiple stresses
marine: coral reefs due to multiple stresses; the sea-ice biome because of sensitivity to warming
water resources in some dry regions at mid-latitudes[19] and in the dry tropics, due to changes in rainfall and evapotranspiration, and in areas dependent on snow and ice melt
agriculture in low latitudes, due to reduced water availability
low-lying coastal systems, due to threat of sea level rise and increased risk from extreme weather events
human health in populations with low adaptive capacity.
Regions: {WGII TS.4.5}
the Arctic, because of the impacts of high rates of projected warming on natural systems and human communities
Africa, because of low adaptive capacity and projected climate change impacts
small islands, where there is high exposure of population and infrastructure to projected climate change impacts
Asian and African megadeltas, due to large populations and high exposure to sea level rise, storm surges and river flooding.
Within other areas, even those with high incomes, some people (such as the poor, young children and the elderly) can be particularly at risk, and also some areas and some activities. {WGII 7.1, 7.2, 7.4, 8.2, 8.4, TS.4.5}
3.4 Risk of abrupt or irreversible changes
<
>
Anthropogenic warming could lead to some impacts that are abrupt or irreversible, depending upon the rate and magnitude of the climate change. {WGII 12.6, 19.3, 19.4, SPM}
Abrupt climate change on decadal time scales is normally thought of as involving ocean circulation changes. In addition on longer time scales, ice sheet and ecosystem changes may also play a role. If a large-scale abrupt climate change were to occur, its impact could be quite high (see Topic 5.2). {WGI 8.7, 10.3, 10.7; WGII 4.4, 19.3}
Partial loss of ice sheets on polar land and/or the thermal expansion of seawater over very long time scales could imply metres of sea level rise, major changes in coastlines and inundation of low-lying areas, with greatest effects in river deltas and low-lying islands. Current models project that such changes would occur over very long time scales (millennial) if a global temperature increase of 1.9 to 4.6°C (relative to pre-industrial) were to be sustained. Rapid sea level rise on century time scales cannot be excluded. {SYR 3.2.3; WGI 6.4, 10.7; WGII 19.3, SPM}
Climate change is likely to lead to some irreversible impacts. There is medium confidence that approximately 20 to 30% of species assessed so far are likely to be at increased risk of extinction if increases in global average warming exceed 1.5 to 2.5°C (relative to 1980-1999). As global average temperature increase exceeds about 3.5°C, model projections suggest significant extinctions (40 to 70% of species assessed) around the globe. {WGII 4.4, Figure SPM.2}
Based on current model simulations, it is very likely that the meridional overturning circulation (MOC) of the Atlantic Ocean will slow down during the 21st century; nevertheless temperatures in the region are projected to increase. It is very unlikely that the MOC will undergo a large abrupt transition during the 21stcentury. Longer-term changes in the MOC cannot be assessed with confidence. {WGI 10.3, 10.7; WGII Figure, Table TS.5, SPM.2}
Impacts of large-scale and persistent changes in the MOC are likely to include changes in marine ecosystem productivity, fisheries, ocean CO2 uptake, oceanic oxygen concentrations and terrestrial vegetation. Changes in terrestrial and ocean CO2 uptake may feed back on the climate system. {WGII 12.6, 19.3, Figure SPM.2}](8_rapporto_IPCC_2007_files/shapeimage_1.png)