Crisi, oggi

Due gli elementi rilevanti della situazione attuale:
La prima é il cambiamento climatico ormai irreversibile, con un progressivo aumento della temperatura e una serie di effetti a questo legati (come l’innalzamento del livello dei mari).
Se qualcuno sostiene che non c’é consenso scientifico su questo siete autorizzati ad impiccarlo al lampione più vicino, in quanto questo tipo di disinformazione é un atto criminale.
Una breve digressione su questo punto forse conviene: quando si parla di opinione della comunità scientifica ci si riferisce a qualcosa di ben preciso, ovvero all’insieme delle pubblicazioni su riviste scientifiche, che vengono filtrate attraverso una revisione dei colleghi (‘peer review’) e quindi dibattute.
Su questo tema il 99% delle pubblicazioni é unanime sull’esistenza del cambiamento climatico con relativo riscaldamento di origine antropogenica.
Non ha rilevanza scientifica il parere di questo o quel personaggio (anche se scienziato e anche se famoso) svolto al di fuori di questi canali, perché ogni pubblicazione deve essere una sorta di dimostrazione, sostenuta da dati ed analisi: se manca questo é pari all’opinione di qualunque altro e altrettanto gratuita; e irrilevante.
Per inciso anche la Exxon ha smesso (anche se non del tutto) da pochi anni di finanziare personaggi pubblici, scienziati e semiscienziati (e anche insospettabili membri di organizzazioni ecologiste) perché sostenessero l’inesistenza del cambiamento.
Oltre e complementare alla comunità scientifica in senso stretto vi é anche l’IPCC (Comitato Intergovernativo sul Cambiamento Climatico), formato da rappresentanti di tutti gli stati scelti dai governi (quindi spesso senza garanzia di imparzialità..e infatti le relazioni sono in genere esercizi di equilibrismo tra quello che si vuol dire e quello che lo stato vuole che si dica - o meglio, non vuole che si dica). Questo organismo fornisce relazioni periodiche (ogni 6/7 anni) che devono orientare le politiche degli Stati, in genere in vista delle Conferenze dei governi.
Le previsioni pubbliche che abbiamo sono prodotte da questo ente, e quindi il frutto di una mediazione (in genere al ribasso).
In sintesi dunque abbiamo previsioni medie (cioé quelle su cui c’é il massimo di convergenza statistica dei diversi modelli) che danno, per la fine del secolo, un
aumento medio della temperatura di circa 6°C e un aumento del livello del mare di circa 80 cm.
Teniamo conto che si tratta sempre di previsioni, con un grado di probabilità diversificato e fortemente dipendente da ipotesi iniziali e dallo stato dell’arte attuale. (E dalle sue carenze).
La seconda sono i vari studi diretti della comunità scientifica, che approfondiscono aspetti parziali; l’elemento interessante di molto studi recenti é l’alto grado di non-linearità dei fenomeni in gioco e la scoperta di una rete di interrelazioni tra fenomeni prima sconosciuta o mal misurata.
Quello che sembra venir fuori dall’insieme di tali studi é una probabilità assai maggiore del previsto dell’innnesco di fenomeni critici e di accelerazioni (oltre ad inaspettati elementi di mitigazione).
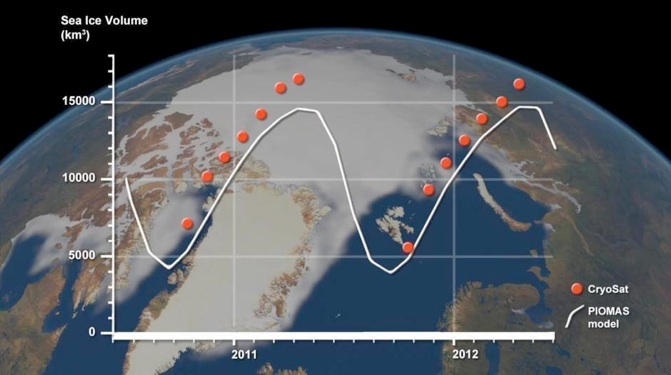
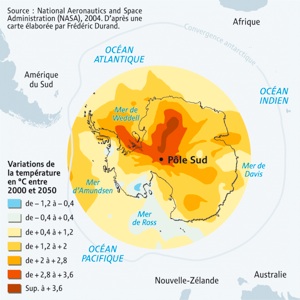
Ad esempio lo scioglimento dei ghiacci (Artici ma soprattutto Antartici e della Groenlandia, quelli più rilevanti per l’innalzamento del livello)) appare procedere ad una velocità assai maggiore del previsto (rispetto a quanto diceva la relazione del 2007), con la conseguenza di una possibilità non trascurabile di aumento del livello del mare di diversi metri.
Di seguito un esempio di uno di questi studi ( oltre all’ultima relazione dell’IPCC).
v.anche il WorldEnergyOutlook2012 (che prevede un aumento di temperatura di 3.6° a fine secolo: in ogni caso il doppio di quello gestibile senza disastri).
____________________________________________________________________________
il plancton diminuisce
In the oceans, ubiquitous microscopic phototrophs (phytoplankton) account for approximately half the production of organic matter on Earth. Analyses of satellite-derived phytoplankton concentration (available since 1979) have suggested decadal-scale fluctuations linked to climate forcing, but the length of this record is insufficient to resolve longer-term trends. Here we combine available ocean transparency measurements and in situ chlorophyll observations to estimate the time dependence of phytoplankton biomass at local, regional and global scales since 1899. We observe declines in eight out of ten ocean regions, and estimate a global rate of decline of ~1% of the global median per year. Our analyses further reveal interannual to decadal phytoplankton fluctuations superimposed on long-term trends. These fluctuations are strongly correlated with basin-scale climate indices, whereas long-term declining trends are related to increasing sea surface temperatures. We conclude that global phytoplankton concentration has declined over the past century; this decline will need to be considered in future studies of marine ecosystems, geochemical cycling, ocean circulation and fisheries.
Figure 2: Local-scale trends in phytoplankton
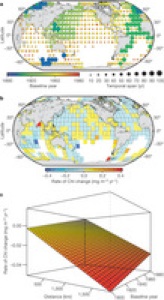
a, Baseline year and temporal span of Chl data used in local models. b, Mean instantaneous rates of Chl change in each 10° × 10° cell (n = 364). Yellow and red represent cells where Chl has increased, while blue represents a Chl decrease.
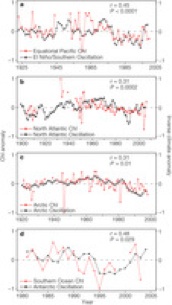
Figure 5: Effects of climate variability on phytoplank
a–d, Linear relationships between normalized and de-trended yearly Chl anomalies (red) and smoothed climate indices (black) for the Equatorial Pacific (a), the North Atlantic (b), the Arctic (c) and the Southern Ocean (d) regions. Pearson co…
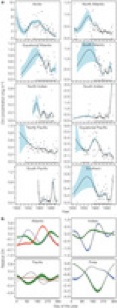
a, GAM estimates of Chl as a discrete (points) or smooth function (lines) of yearly variability in each region (n = 10). For each initial year, Chl is the arithmetic, rather than model-estimated, mean. Temporal data availability is displayed…
__________________________________________________________________________________________
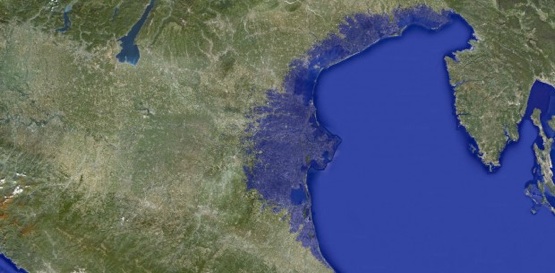
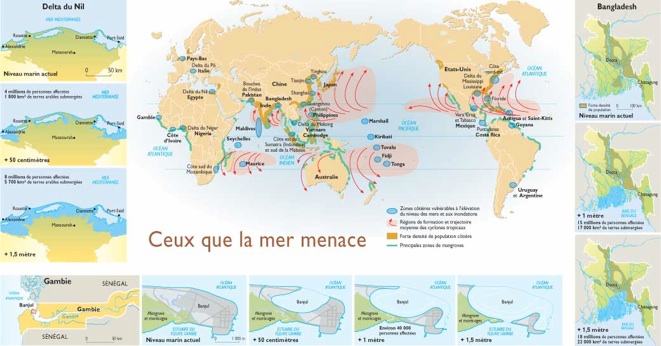
Simulazione dell’innalzamento di 1m del livello del mare
da Global and Planetary Change, Antonio Zecca e Luca Chiari della Università di Trento
: ‘entro il secolo ci sarà un innalzamento di 95 cm’: rappresentazione grafica (in blu sott’acqua)
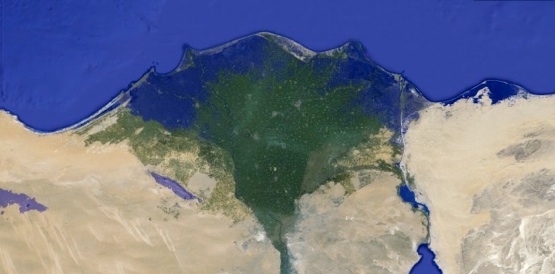
delta Nilo
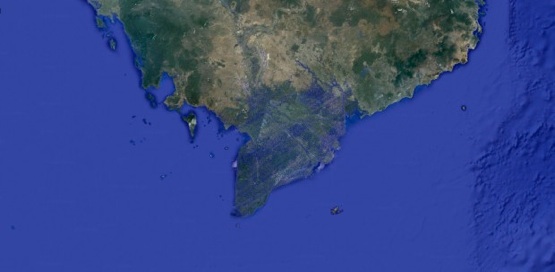
Vietnam
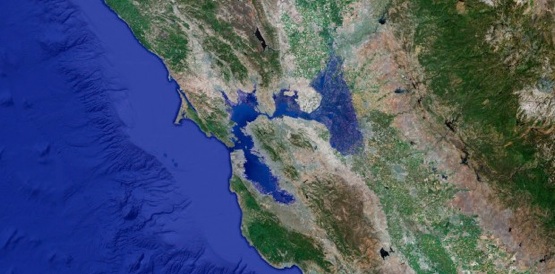
baia di San Francisco
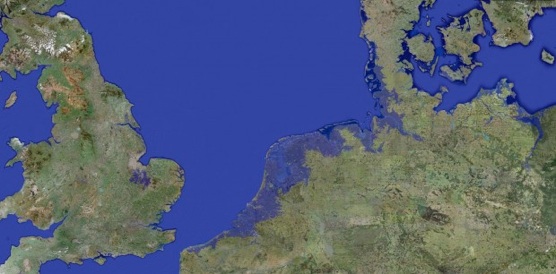
coste olandesi
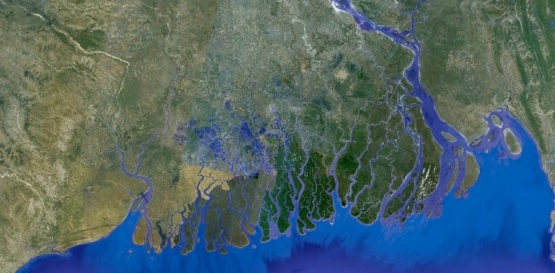
Bangladesh
il delta del Po
I LIMITI DELLO SVILUPPO
Pattern of growth (da ‘Nature Physics’, Novembre 2012)
Controversy and disagreement over economic growth — its necessity, costs and potential limits — started several centuries ago. In the early 1800s, Thomas Malthus first suggested that the human species faced physical and biological constraints that would inevitably check its growth through famine and disease. When Malthus’s fears didn’t materialize, later economists drew confidence: perhaps human ingenuity and progress know no limits?
More recently, the ‘Limits to Growth’ movement — stimulated by a book of the same name published in 1972 by a think-tank known as the Club of Rome — took seriously the observation that economic growth has costs and consequences, especially in environmental degradation. Simple computer models were used to explore likely scenarios for future human development on Earth; results suggested that continued growth in a ‘business as usual’ scenario would likely end in socioeconomic collapse sometime in the twenty-first century. These concerns weren’t so much shown to be wrong as ignored or shouted down by influential economists and business interests; a recent study revisited the book’s predictions and found many of them to be more or less on target (G. Turner, GAIA 21, 116–124; 2012)
To many economists, it seems, the idea of limits to growth breaks in an unacceptable way with central theoretical notions about the benefits of technological innovation and economic exchange. But discussions over the matter really do involve a collision of ideas and methods from the social and physical sciences, a collision of very different ways of thinking. If we’re going to build a serious understanding of growth, its ultimate consequences and future, there has to emerge a science that is both social and physical at the same time.
Physicist Tom Murphy gives a highly amusing account of a chance conversation at a scientific meeting between himself and a prominent economist (http://go.nature. com/GvhWsc). Murphy raised the matter of limits to growth, pointing out that growth in energy use has held steady at around 2% yearly over the past three centuries. Exponential growth of this kind, if perpetuated, has rather obvious limits owing to thermodynamics alone. Talk all you want of future improvements in energy efficiency, but the energy we use always ends up as heat in the environment. With 2% yearly growth, this energy dissipation alone, Murphy argues, would be enough to boil the oceans in only four centuries.
This is, of course, a reflection of just how violently fast exponential growth really is. That pattern simply cannot continue. From a fundamental perspective, we’re going to ultimately have to limit our use of energy (barring fantastic visions such as escape to outer space).
But maybe, the economist countered, we can find a way to continue economic growth without using more energy, or at least without energy use growing as fast? We might find a way to use our energy more intelligently. In particular, we’re clearly shifting our economic activities on a massive scale to be more information-intensive, with many goods and services linked only to the processing or production of information. Perhaps we might find ways to process information (reversible computation, for example) that would consume very little energy, and thereby uncouple economic growth from energy growth?
Murphy’s recollection of the conversation ends with some questions hanging in the air, such as whether perpetual economic improvement might still be possible even with a fixed overall gross domestic product (GDP).
If so, it seems, this kind of ‘growth’ would be very different from what we know today, which is economic growth directly linked to energy growth. In an interesting study last year, biologist James Brown and others assembled global data on economic growth and energy use from the period 1980–2003 to scrutinize the link between the two. They found that across many nations, energy use doesn’t seem to grow quite as fast as economic output; rather, there’s an efficiency of scale that begins to kick in. Larger economies require more energy, certainly, but they use it somewhat more efficiently than smaller economies.
More specifically, they used data on energy use and GDP for 220 nations. The energy use included the metabolic consumption of the human population, as well as the energy of all sources used for industry, transport and so on. Plotted on a per capita basis, the data show a robust scaling relationship, with considerable variation between nations: generally, energy use increases in proportion to GDP raised to the power of 0.75 (it is slightly sub-linear). Some countries (Russia, Ukraine, China) were less energy efficient, whereas others (Congo, Hong Kong, Japan) were more efficient. Over time, all grew roughly along the same scaling path (J. Brown et al., Bioscience 61, 19–26; 2011).
Curiously, this scaling pattern looks very much like that known in biology for the scaling of animal metabolic rate with body mass. Brown and colleagues suggest this may reflect the fact that economies really do have something closely akin to a metabolism, as they “consume, transfer and allocate energy” to maintain all the structures and processes on which economic function depends. The authors also looked at a host of measures related to the ecological footprint of various nations — total waste, electricity and aluminium produced; televisions per 1,000 people — and found, at least over the period considered, that no nation has managed to increase GDP without at the same time using more energy and natural resources, with attendant increasing environmental impact.
Hence, there seems to be a natural relationship between economic activity and energy used, at least as we have conceived and practised economic activity so far. More activity generally demands more energy use, and we do not yet have a counter example of any nation growing economically while using less energy. In this sense, the notion of the information economy that would become somehow detached from greater energy use remains more fantasy than reality.
Perhaps some fundamental transformation in our future technology will reduce the pattern described here to a historically contingent and only temporary relationship. Perhaps one day soon we will be able to grow economically and do more with less. But there’s nothing to support that idea at the moment.
To believe in unlimited growth right now still seems to be an act of pure faith. ❐
MARK BUCHANAN
John Baez Cicli di Milankovitch
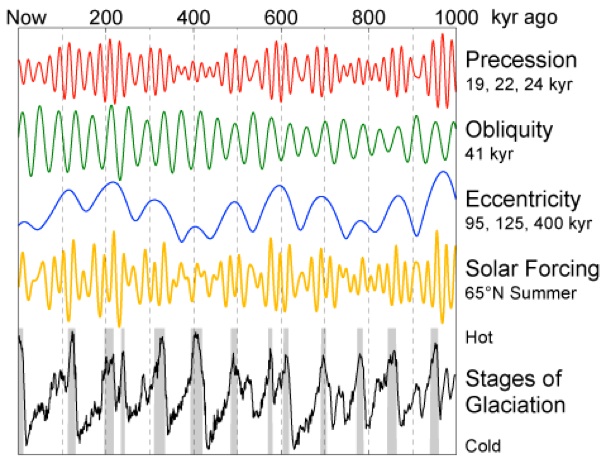
This figure shows the variations in Earth's orbit, the resulting changes in solar energy flux at high latitude, and the observed glacial cycles.
According to Milankovitch Theory, the precession of the equinoxes, variations in the tilt of the Earth's axis (obliquity) and changes in the eccentricity of the Earth's orbit are responsible for causing the observed 100 kyr cycle in ice ages by varying the amount of sunlight received by the Earth at different times and locations, particularly high northern latitude summer. These changes in the Earth's orbit are the predictable consequence of interactions between the Earth, its moon, and the other planets.
The orbital data shown are from Quinn et al. (1991). Principal frequencies for each of the three kinds of variations are labeled. The solar forcing curve (aka "insolation") is derived from July 1st sunlight at 65 °N latitude according to Jonathan Levine's insolation calculator [1]. The glacial data are from Lisiecki and Raymo (2005) and gray bars indicate interglacial periods, defined here as deviations in the 5 kyr average of at least 0.8 standard deviations above the mean.
_______________________________________________________________________________________
Il gas che cuoce il pianeta ma salva gli Usa dalla Cina
di Mario Agostinelli | 21 dicembre 2012
In una serie di documentati articoli sulle pagine di Repubblica, Federico Rampini espone la strategia degli Stati Uniti guidati da Obama per mantenere l’egemonia geopolitica e militare a fronte dell’impetuosa crescita cinese. Parte decisiva di questa strategia è rappresentata dal progetto di estrazione di gas (e petrolio) dagli scisti bituminosi (shale gas), che porterebbe Usa e Canada a soppiantare il primato nelle fonti fossili dei Paesi Arabi e della Russia e a determinare così un confronto diretto nella competizione economica con Pechino da posizioni di forza.
A quale prezzo per il pianeta e per la vita futura? E dove sta il trucco per avere a basso prezzo un prodotto che richiede più energia per ottenerlo di quanta ne restituisca? Vale la pena di accennarne in questo primo post cui seguirà un altro. Sarà così più facile capire e la fiera e opportunistica opposizione di Washington e Ottawa all’adesione al protocollo di Kyoto, con conseguente affossamento della recente conferenza di Doha.
Il gas da scisto si ottiene con la fratturazione idraulica di rocce che contengono bitume disperso. Si tratta di perforazioni orizzontali ai depositi di scisti a profondità fino a 3 km, con pompaggio in grandi quantità di lubrificanti, acqua, sabbia e sostanze chimiche ad altissima pressione. Oltre alla devastazione paesaggistica, naturale e del suolo, la tecnica comporta – per le emissioni di CO2 e di metano – un alto rischio per la salute umana e per l’ambiente. Altro che effetto serra! Inoltre provoca conseguenze disastrose sulla contaminazione e l’esaurimento delle acque sotterranee e superficiali, sulla biodiversità, sul degrado del suolo e della qualità dell’aria, oltre a condizioni sismiche, accompagnate da non trascurabili livelli di materiale radioattivo naturale portato in superficie.
L’Unione Europea si sta per ora opponendo a questa pratica, nonostante la pressione della Polonia, che vorrebbe così ottenere un’indipendenza energetica ad ogni costo, e il pressing di grandi lobby come la Shell per avviare perforazioni di scisti marini. Senza contare anche l’attività frenetica dei rappresentanti del settore del governo canadese, che tra il settembre 2009 e luglio 2011, hanno organizzato oltre 110 eventi a Bruxelles (più di uno a settimana!).
Quale sarebbe la contropartita per Usa e Canada (con cui concorda evidentemente il governo Monti che ha proposto una Strategia Energetica nazionale (SEN) fondata sul rilancio di gas e petrolio) a fronte di un’accelerazione della crisi climatica? (N.B. Il gruppo di studio della Ue attribuisce all’effetto serra da shale gas un valore di default di 107 grammi di CO2 equivalente per megajoule (CO2eq/MJ) di carburante, rispetto alla media di 87.5g CO2eq/MJ per il petrolio).
Paradossalmente il vantaggio sta in un costo al mercato inferiore di un terzo rispetto al gas tradizionale, ottenuto artificialmente attraverso i raggiri delle banche sui prodotti derivati e su tutte le forme speculative che stanno dietro alla costruzione di pozzi e gasdotti, al varo di navi metaniere e all’attivazione di rigassificatori. Alla fine, queste operazioni sono pagate dai tagli alle pensioni, dal peggioramento delle condizioni di vita e di salute, dal dissesto della natura indotto dai cambiamenti climatici. Una bella storia moderna, un po’ sottaciuta dai media, che sa di vecchio e su cui torneremo.
_________________________________________________________________________________________
La dipendenza dell’umanità dai combustibili fossili sembra non avere mai fine: dopo aver estratto e bruciato il greggio e il carbone di migliore qualità, l’appetito delle multinazionali si sta rivolgendo verso le fonti più “sporche”: petrolio “sour”, oli di scisto, e sabbie bituminose (foto in alto).
Greenpeace prende in considerazioni i 14 più grandi progetti di sfruttamento fossile a livello planetario e stima che se verranno realizzati tutti, entro il 2020 le emissioni di CO2 potrebbero aumentare di oltre 6 miliardi di tonnellate, il 20% in più rispetto alle 31 Gt del 2011.
Una prospettiva terribile, che potrebbe portarci oltre il punto di non ritorno, spingendo il clima del pianeta verso un aumento letale di temperatura intorno ai 5-6 °C.
Il carbone in particolare detiene la parte del leone delle possibili emissioni con 3 miliardi di tonnellate.
Perché permettere che una manciata di governi e di compagnie petrolifere decidano del futuro dell’umanità? Non siamo forse il 99%? E’ bene iniziare a capire chi intende compiere queste devastazioni, per dissociarsi progressivamente e boicottarne prodotti e servizi.
I quattro progetti di maggiore impatto ambientale sono localizzati in
Cina: aumento della produzione di carbone di 620 Mt entro il 2015, con emissioni per 1400 Mt CO2 (quanto quelle dell’intera Russia)
Australia: oltre 760 Mt di Co2 all’anno per l’aumento delle esportazioni di carbone, più di tutte le emissioni per i consumi interni
Usa: 700 Mt di emissioni associate con le estrazioni di carbone (420 Mt) e di olio di scisto (280)
Artico: la fusione della calotta polare potrebbe permettere trivellazioni per greggio e gas, con emissioni associate di 520 Mt nel 2020 e 1200 Mt nel 2030.
da Marco Pagani, il Fatto Quotidiano, 28/1/2013
____________________________________________________________________________
Polo Nord, scioglimento della calotta: le nuove analisi (Cryosat) anticipano lo scioglimento completo al 2020. (satelliteCryoSat dell’Agenzia spaziale europea (Esa).)
sabato 3 novembre 2012
Clima


1- alcuni grafici di elementi critici...ed una presentazione/sintesi
2- una sintesi
3- ‘il plancton diminuisce’
5- innalzamento del livello del mare: chi va sott’acqua; clima, il livello dei mari
6- ‘Limiti dello sviluppo’
7- cicli secolari dell’insolazione
8- Fonti di energia e nuove emissioni
9-Exxon: the climate skeptics market
10- Kochtopus
11- Ghiacci artici